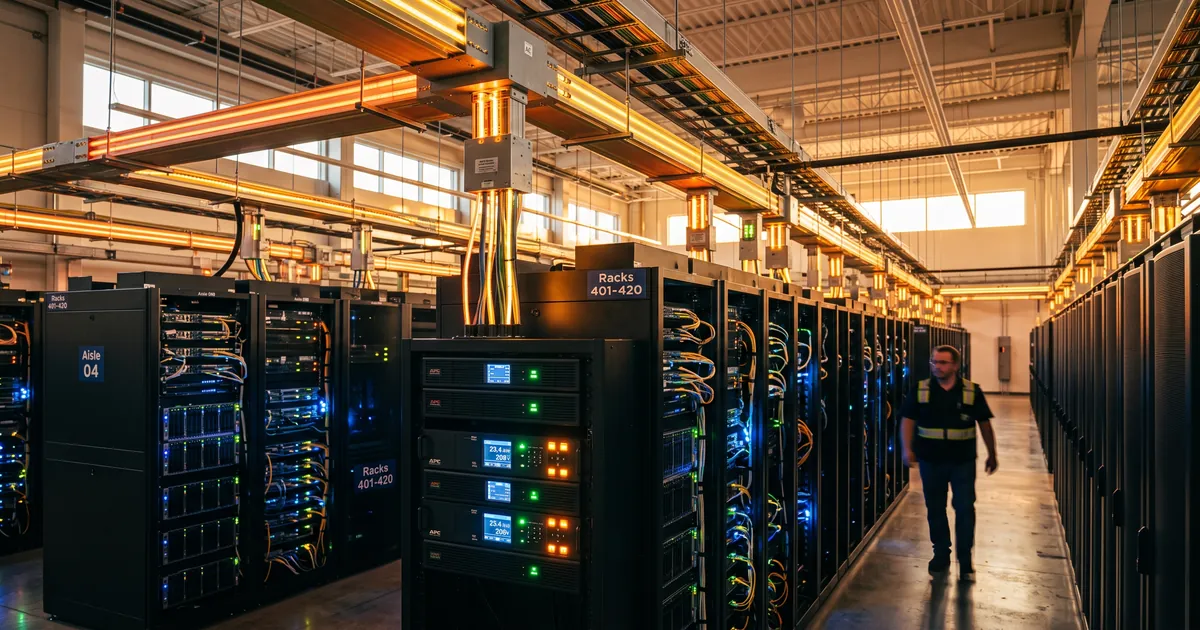
The widely cited data center power consumption are based on a modeled estimate, not a meter reading. Load factor, the ratio between rated capacity and actual draw, determines grid strain, utility bills, and how much announced buildout determines the real demand.
Everyone Cites Measured Capacity, Not Actual Power Draw
The International Energy Agency’s 2025 energy and AI analysis puts global data center electricity use at roughly 415 terawatt hours in 2024, about 1.5% of world consumption. The Congressional Research Service’s 2025 data center energy brief puts US data center consumption at approximately 176 terawatt hours in 2023, near 4.4% of national use, up from about 58 terawatt hours a decade earlier. These numbers are based on reserved capacity, not what is actually being seen at the operator level.
Why Nameplate Power Ratings Overstate Real Electricity Use
Every facility in pipeline announcements is sized to a total max capacity, not the actual operational value. This max capacity rating must cover the worst case scenarios, N+1 or 2N redundancy on UPS and cooling plant. It also usually includes headroom for future tenants or hardware refresh, plus a good measure of margin to make sure the design passes commissioning. This total max capacity is never meant to be reached. A facility commissioned at 100 megawatts commonly runs well under that, and even a mature, fully tenanted site rarely sustains full max power around the clock.
Load Factor, The Missing Variable in Consumption
Load factor, average draw divided by rated nameplate capacity, reconciles the massive numbers in news headlines with actual consumption. If US data center capacity ran near 100% load factor, national figures would exceed the 176 terawatt hours that the Congressional Research Service cites for 2023. They do not, and failure to consider this difference, treating a capacity announcement as an immediate addition to national electricity demand, is a mistake.
AI Racks Make the Gap Bigger, Not Smaller
A conventional enterprise rack runs 5 to 15 kilowatts with a flat draw profile. AI training and inference racks change that. Rated draw per rack is now commonly 40 to 100+ kilowatts, and the load itself comes in bursts. A training job can swing a GPU cluster from idle to full power in seconds, then back down between batches. That combination of a higher power rating and wider swings in utilization widens the gap between what an AI-focused facility is provisioned for and what it draws. A facility built for a 60 megawatt AI cluster could average well under half that across a typical operating month, depending on training schedules and job mix.
What This Means for Grid Planning and Public Debate
Utilities and grid operators plan for a facility’s contracted capacity, that is the max capacity, because that is the number they are obligated to serve. This ensures grid reliability should the facility ever demand its max capacity. But it means “X gigawatts of new data center demand” figures in grid impact studies and news coverage are peak provisioning numbers, not forecasts of actual annual electricity consumption. Reporting on grid strain often cites capacity figures that overstate the data centers’ contribution to the problem.
Where Does That Leave Operators and Planners?
Better visibility into facility level load factor is required. Measurement of sustained draw against rated capacity, tracked over time to see the trend. Like your PUE numbers, they are not static; they are dynamic, and an average over some time period should be considered as a better indication of the actual facility power impact on the national grid. Until facility-level, ongoing measurement is the default rather than the exception, every debate about data center power consumption will run on numbers describing design intent, while the number that matters on the ground is what a given facility draws today versus what it was built to draw.
Leave a comment