- US data centers consumed roughly 17.5 billion gallons of water directly in 2023, a figure projected to double or quadruple by 2028.
- Indirect water use from electricity generation typically makes up more than 80 percent of a facility’s total water footprint, not the cooling towers on site.
- Water Usage Effectiveness, the metric built to compare facilities, ranges from near zero for air cooling to 2.5 liters per kilowatt-hour for evaporative cooling.
Billion-gallon headlines reveal the scale of data center water demand, but they do not explain how to reduce it. That requires measuring water use alongside electricity, understanding where heat is rejected, and distinguishing water circulating through cooling equipment from water actually consumed.
Look beyond the municipal water meter
Lawrence Berkeley National Laboratory’s 2024 US Data Center Energy Usage Reportestimated that US data centers directly consumed approximately 66 billion liters, or 17.4 billion US gallons, of water in 2023. It also estimated an indirect water footprint of nearly 800 billion liters associated with electricity generation. These estimates cover US data centers overall, not AI workloads alone.
Direct consumption occurs at the facility, particularly through evaporative cooling. Indirect consumption occurs upstream, including at power plants supplying electricity. The balance varies with cooling design, climate and the generating mix; a national average cannot describe every site.
A facility with no routine evaporative cooling can still have an upstream water footprint. However, eliminating cooling towers does not automatically transfer an equivalent volume of consumption to the grid. The outcome depends on the change in electricity demand and the water intensity of its supply.
Keep withdrawal and consumption separate, too. Water withdrawn is taken from a source; water consumed is not returned to that source for immediate reuse, for example because it evaporates. A utility meter measures incoming supply, not necessarily net consumption.
Read WUE and PUE together
Water Usage Effectiveness (WUE) relates water use to IT energy. The Green Gridintroduced both site WUE and a source-based measure that includes water associated with energy production. ISO/IEC 30134-9:2022 establishes a standardized framework for WUE reporting.
Site WUE = annual site water use (liters) ÷ annual IT equipment energy (kWh) PUE = total facility energy ÷ IT equipment energyState the water-accounting boundary and use matching reporting periods. A cooling-only “zero water” claim needs a clear explanation of what is excluded.
Evaporative cooling can reduce cooling electricity while consuming water. Dry cooling avoids routine evaporation, but its energy performance depends on outdoor conditions and required cooling temperatures. Warm-water liquid cooling can also support efficient heat rejection with less mechanical refrigeration.
There is no universal energy penalty for low WUE. Compare complete cooling systems over the year, including pumps, fans and chillers. Track absolute water and energy totals alongside the ratios, and consider local water scarcity: identical WUE values can have very different consequences in different watersheds.
Liquid cooling does not define the final heat-rejection method
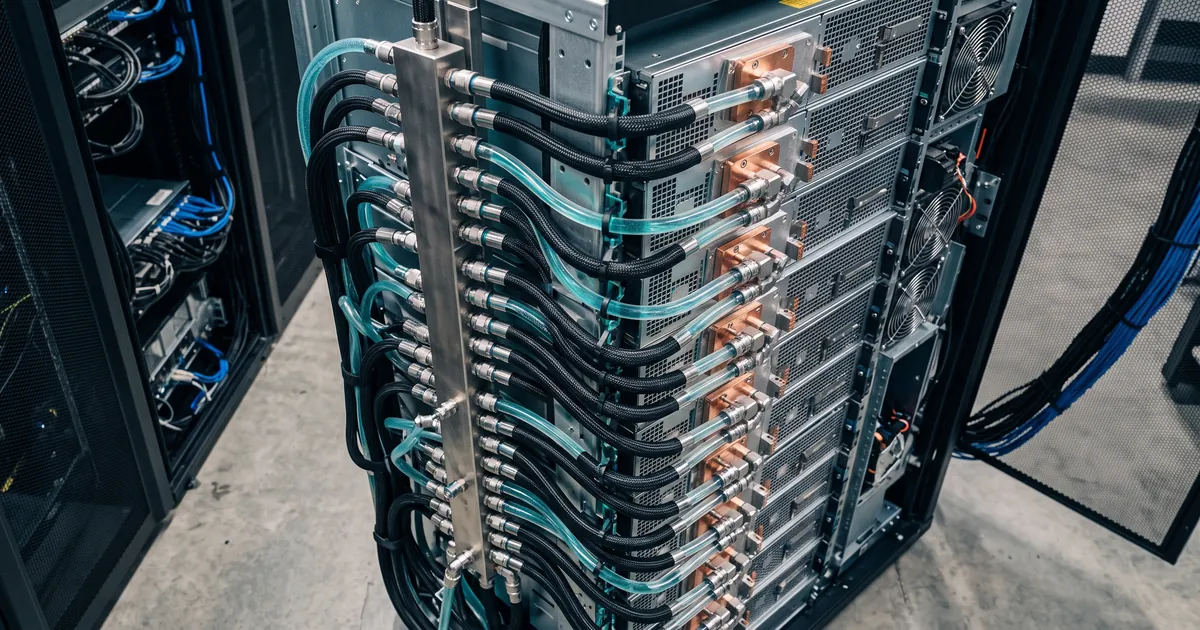
Direct-to-chip cooling describes how heat leaves the electronics. It does not, by itself, tell you whether the facility ultimately rejects that heat through a cooling tower, dry cooler or another system.
A liquid-to-liquid cooling distribution unit (CDU) transfers heat between the IT coolant circuit and the facility water circuit. The secondary loop can recirculate coolant while the facility’s heat-rejection equipment consumes water elsewhere. A closed loop therefore does not automatically mean a water-free facility.
Coolant flow is different from water consumption
A loop circulating hundreds of liters per minute is not necessarily drawing that volume from the water supply. In a closed circuit, the same coolant repeatedly carries heat through the system.
For preliminary planning, use the AKCP Chilled Water Flow Calculator to explore cooling duty, flow and temperature rise. For example, a loop carrying 150 kW of heat with plain water requires approximately 3.6 L/s at a 10°C temperature rise, or 7.2 L/s at 5°C. These are circulation rates, not consumption rates.
Calculate the CDU facility and secondary loops separately. Final CDU selection also requires manufacturer performance at the intended temperatures, heat-exchanger approach, available pump pressure, circuit pressure drop, coolant properties and redundancy requirements. Use the heat actually captured by the liquid system; some rack heat may still require air cooling.
Measure the complete cooling system
Useful monitoring connects the resource meters to the equipment they serve:
- Water: meter incoming supply and cooling-tower makeup, and measure or account for blowdown and other outgoing flows. Identify potable and reclaimed supplies separately.
- Energy: measure facility and IT energy at defined boundaries, then submeter cooling plant to identify changes in overhead.
- Liquid cooling: trend supply and return temperatures, flow, differential pressure, pump power and CDU status using readings from the same circuit and time.
- Rack conditions: monitor inlet temperatures, humidity and airflow conditions, including the residual air-cooling load around liquid-cooled equipment.
AKCP Thermal Map Sensors provide rack temperature measurements at the top, middle and bottom, with humidity monitoring. Front and rear measurements help reveal hot spots and temperature differences. The Cabinet Analysis Sensor adds differential pressure information to support investigation of airflow and containment performance. Pressure alone does not prove that containment is leak-free.
Quicklime DCIM can combine AKCP sensor readings with compatible third-party meters, chillers and CDU data through supported interfaces such as SNMP and Modbus. With the required meters and accounting boundaries in place, engineers can compare cooling conditions with water and energy trends, investigate changes, and verify the results of operational adjustments.
Leave a comment